More Projects
59 in total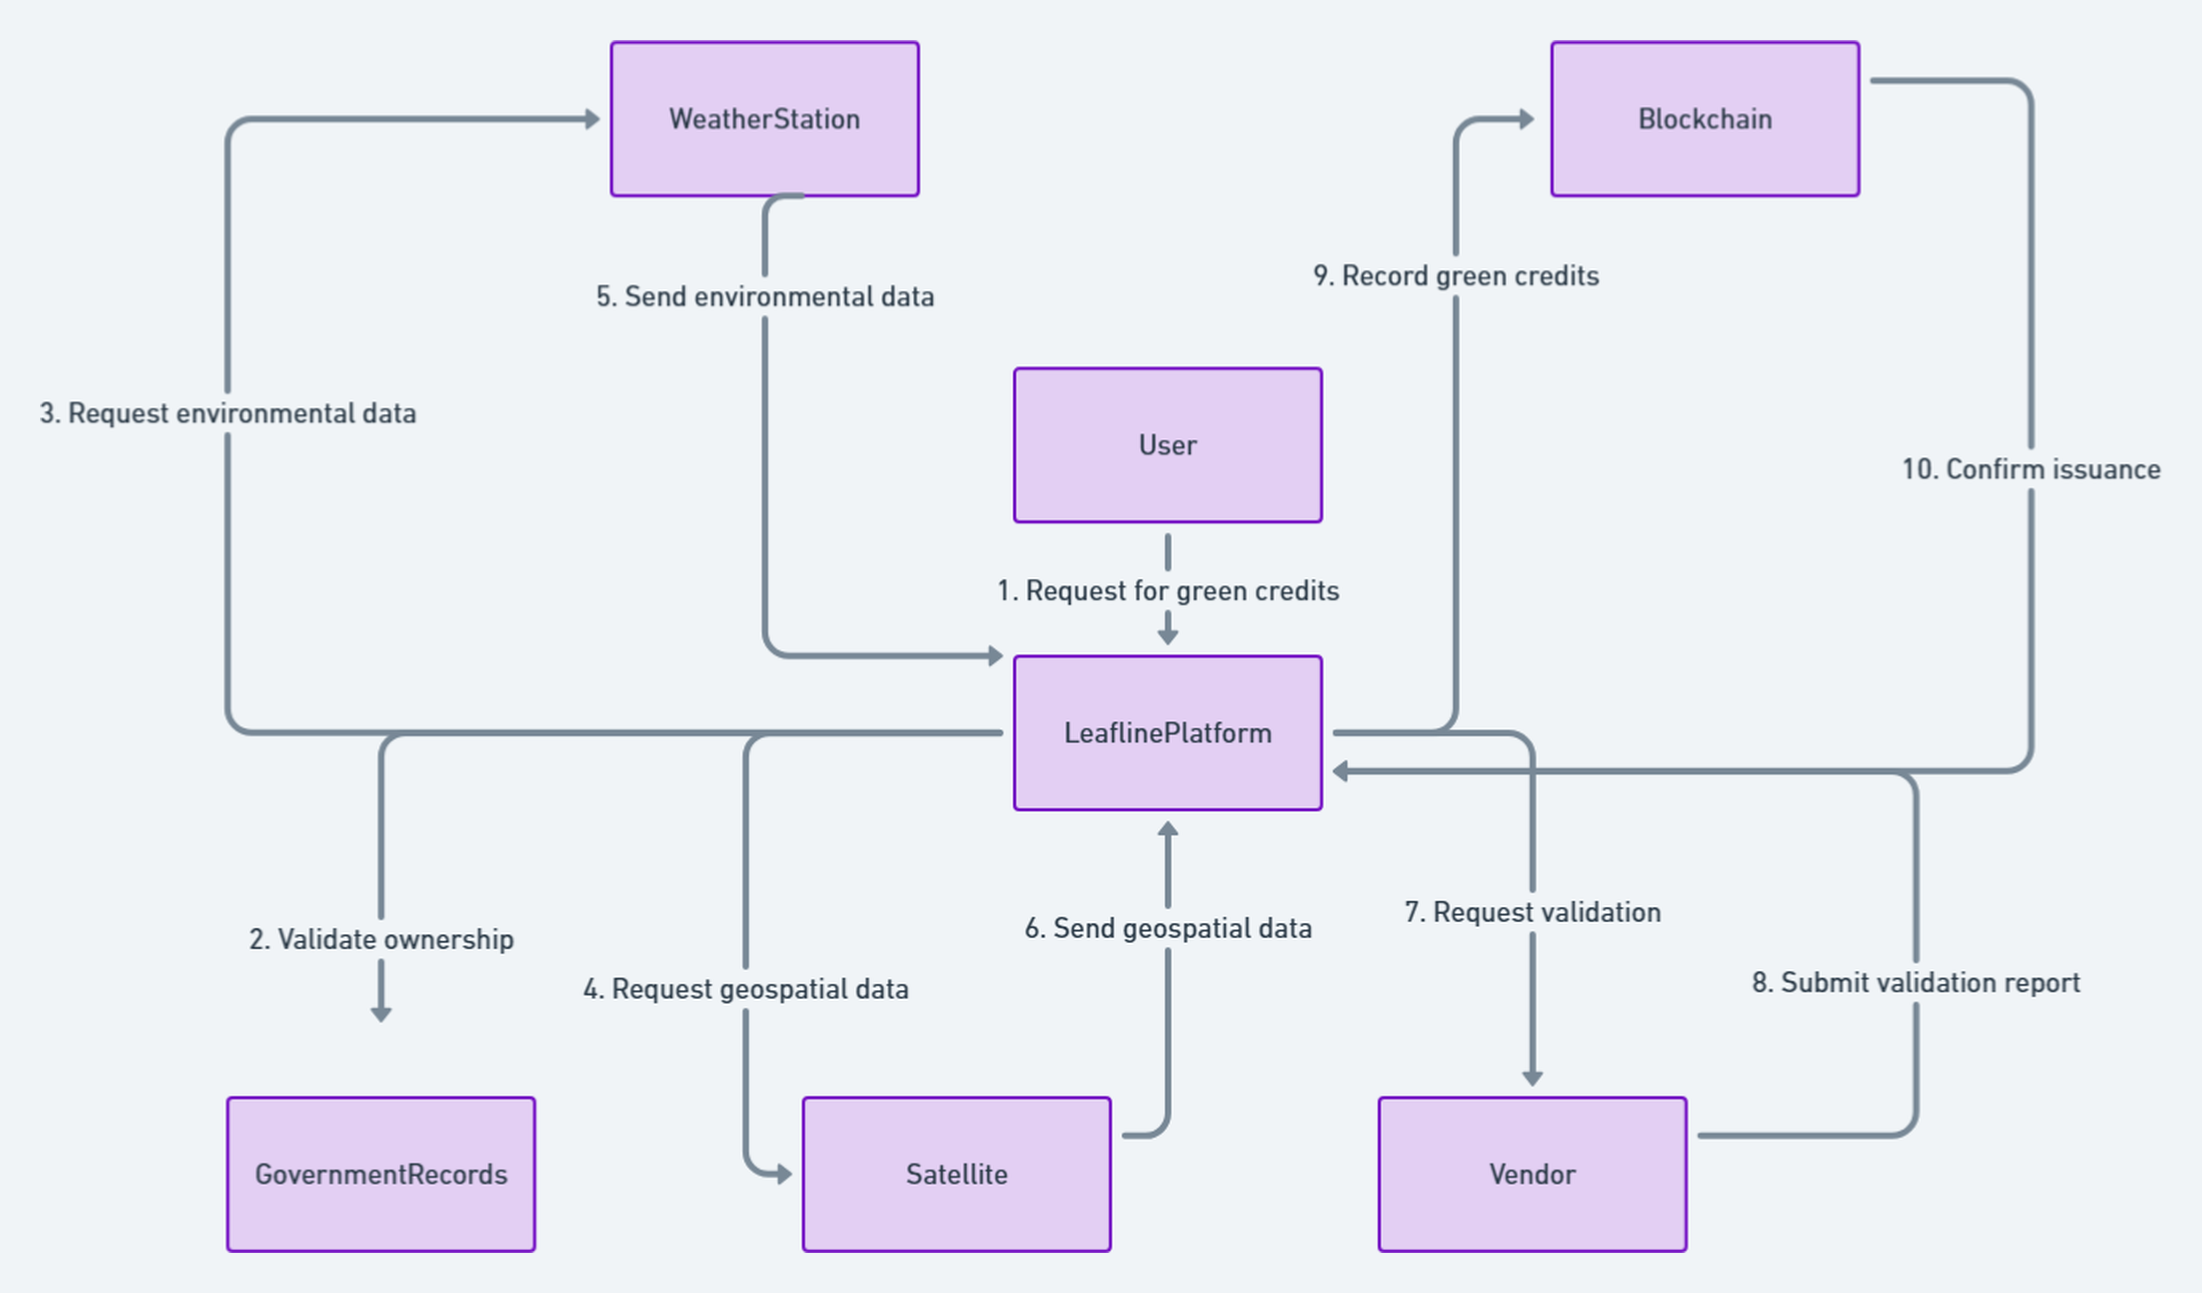
LeafLine — Green Credit Marketplace
Contributor · 2024
Winning SAP Hackfest 2024 system for green credits, built on one rule: every figure on a listing had to be something a machine could re-derive — coordinates into a live pollution reading, an image into a pixel count. A React/MUI console draws the land parcel on a Google Maps satellite layer, computes its area, prices a credit from live air-quality readings, lists and buys credits and charts activity, with a Node WebRTC/ffmpeg ingest and a Flask relay carrying geotagged phone video as live field evidence rather than an uploaded file. Behind it sits an Express/Mongoose marketplace for geo-indexed parcels, listings and certificate-stamped trades, plus two Flask services that know nothing about orders: one prices a credit from OpenWeatherMap air-quality readings, the other reports green cover by HSV thresholding the parcel's satellite still.
SAP Hackfest 2024 — Winner (25,000 participants)
 React
React MUI
MUI Firebase
 Google Cloud Storage
 Google Maps
 WebRTC
 FFmpeg
 Node.js
 Express
 MongoDB
 Python
 Flask
Flask OpenCV
 NumPy
NumPy geopy
geopy Docker
Project Details
Contributor
2024
SAP Hackfest 2024 — Winner (25,000 participants)
Hackathon · Web
Carbon credit markets have a pricing problem: a credit issued over clean rural land and a credit issued next to a coal plant are not worth the same thing, but most registries treat them as interchangeable. LeafLine prices a credit against the air its land actually sits in, and verifies the land's green cover from a photograph rather than a filed declaration.
Both of those are normally solved with paperwork. Air quality gets attested in a report, green cover gets attested by a surveyor, and the naive software version of that is a form with a number field and a file upload. That moves the paperwork without changing what it is worth, because nothing in the pipeline can disagree with the seller. So the rule we set was that every figure on a listing had to be something a machine could re-derive from scratch: coordinates into a live pollution reading, an image into a pixel count. That decided the shape of the system before any of it was written, because neither of those computations belongs anywhere near an orders API.
The same logic runs through the console. A parcel boundary is not an address, and two adjacent claimants can describe the same hectare in words that both sound correct, so the claimant draws the polygon on imagery and the claim becomes geometry. A photograph proves nothing either, because the cheapest way to claim a forest you do not own is to photograph somebody else's, so the evidence is a live stream from a phone that reports where it is standing while it is standing there.
Separate services, deliberately
What shipped is a Node marketplace, two Python services that know nothing about it, and a React
console on top, with two more processes carrying the video evidence. The Express app owns land,
orders and listings. One Flask app turns a place into a price, another turns an image into a
green-cover percentage. They talk over HTTP and share no database, which sounds like overhead for a
hackathon until you are changing the pollutant weight table for the fourth time in an evening and
the marketplace does not have to restart. Both Flask services build on python:3.11-slim with the
OpenCV system libraries installed, run under gunicorn bound to 0.0.0.0:5000, and are mapped out by
compose on distinct host ports, 6001 for pricing and 6002 for green cover; the Node API reads
MONGODB_URI and PORT from a dotenv file and defaults to 3002. Nothing is orchestrated together,
which is the point: three compose files, three deploy decisions.
Drawing the parcel
poly.js is where the claim starts, and it is deliberately crude. A Google Maps instance opens in
satellite type over the campus, every click drops a marker, and lockArea() refuses to close the
shape until there are at least three of them. It then threads a Polyline through the markers and
converts that into an editable, draggable Polygon, so a boundary that came out slightly wrong can be
nudged rather than redrawn.
Area comes out of the bounding box rather than a paid geodesic API: latitude degrees at 111 km each,
longitude scaled by cos(avgLat). For a parcel a few hundred metres across the error is small enough
to price against, and the alternative was a metered call on every draw. That is the tradeoff the file
makes explicitly, and it is defensible right up to the point where a parcel is long, thin and
diagonal, at which case the bounding box is much larger than the polygon inside it.
Pricing what was drawn
Locking the area kicks off the part that makes this a credit system rather than a mapping toy. The console pulls a 600x900 satellite still of the parcel centre at zoom 19 from the Static Maps API, posts that image to the green-cover service, and gets back the fraction of the frame that is dark green, light green and green overall. It then posts the parcel's centre and area to the costing service, which returns an adjusted area cost, an original credit cost, and the ambient concentrations of carbon monoxide, ammonia, nitric oxide, nitrogen dioxide, ozone, sulphur dioxide and both particulate fractions. Those two numbers together are the claim: this much canopy, in air this dirty, is worth this many credits.
Feature set
- Registration records in Firestore. Land alias, address, price, a land-type category (Village, Forest, SubUrban, Urban) and an uploaded ownership document, written through the Firebase v9 modular SDK with Google Cloud Storage behind the file upload.
- Geo-indexed land registry on the API side. An Express/Mongoose
Landmodel carrying the owner, a land document, a land video, initial and remaining credits, with a2dsphereindex on the GeoJSONgeoTagso parcels can be queried by proximity. - Order flow with a certificate id.
POST /create-ordervalidates seller, buyer and credit count, mints a 16-bytecrypto.randomByteshex certificate hash, and increments the seller'scredits_soldin onefindOneAndUpdate. Before responding it SHA-256 hashes both parties, posts{sender, receiver, amount}to a separate transaction service and deletes its own order document- the ledger, not Mongo, is the record of the trade.
- Marketplace reads.
/registered_landand/buy-creditsback the listing and purchase screens, with abuy_creditsschema carrying price, location, validity and registration date, alongside a flatter denormalisedregistered_landsview - name, price, location, area, green cover, status, date and user id - written for the dashboard rather than for the trade. - Credit marketplace in the console. A paginated MUI table of purchasable credits fetched from
the Node API, with an order form that posts the same
{sender, receiver, amount}transaction. - Air-quality pricing service. A Flask app that geocodes a place name through geopy's Nominatim or takes raw lat/lon, pulls the OpenWeatherMap air-pollution endpoint, and reads nine values - AQI plus CO, NO, NO2, O3, SO2, PM2.5, PM10 and NH3, each pollutant normalised against a hardcoded ceiling and scored twice before it reaches the price.
- Green-cover estimator. A second Flask service takes an uploaded image, converts to HSV, and
runs two
inRangemasks - dark green at hue 40 to 70, light green at 35 to 85 - cleaned up with a 5x5 morphological close, then reports dark, light and total green as a share of total pixels. - Monitoring logs. A per-land AQI readout computed client-side from EPA-style piecewise breakpoint tables for ozone, particulate matter, CO, SO2 and NO2 - each concentration is linearly interpolated into its sub-index band and the overall AQI is the maximum of the five, which is how the real index is defined.
- Change flagging. A land is marked and its card painted red when any day's AQI falls more than twenty points below the previous day's, so a step change in the readings surfaces without anyone reading the table.
- Analytics dashboard. GeoChart, pie, bar and vertical-bar views through react-google-charts, with animated counters over the summary tiles.
- Field phone app. A small Flutter client that subscribes to the platform location stream with a one-metre distance filter and writes latitude, longitude and a server timestamp into Firebase Realtime Database on every movement.
- Routed console shell. Home, register land, buy credits, monitoring logs, analytics, settings
and a per-land
/history/:landIdview, with zustand holding shared table state. - Containerised per service. Each Flask app ships with its own Dockerfile, compose file and gunicorn entry, so the Node API and the two Python services deploy independently.
Reading the pricing function
It is worth being concrete about what the pricing formula does, because the interesting behaviour is not obvious from the description. The ceilings are fixed constants: AQI 5, CO 1000, O3 200, PM2.5 and PM10 50, and NO, NO2, SO2 and NH3 20 each. Each pollutant is scored once with fixed reference weights and once with weights derived from the live readings normalised to their own maximum, and the difference between the two weight sets feeds a weighted pollution index. The reference table is not uniform either - CO carries 567.44 against NO's 0.84 - so once the live readings are squashed into zero-to-one and subtracted, the reference table still dominates. Multiply that index by a per-unit cost table (NO2 is the expensive one at 200 a unit, O3 the cheap one at 80), scale by a demand-over-supply term, divide by a million and apply the result as a percentage nudge to the base area price, which starts at 100 per acre. The output is a small adjustment on a base price rather than a price on its own, which is the right shape for something meant to sit next to an existing valuation.
The pricing app also carries its own previous version alongside it. app_v1.py exposes a read-only
GET /get_aqi that returns the raw components plus a category label from a six-level table, good
through hazardous. The v2 file kept the fetching and dropped the labels, because by then the number
that mattered was the price and not the adjective.
The evidence path
The video path is three processes, and the split is the interesting part. The phone is a plain
browser page that grabs getUserMedia and offers a peer connection. The Node service runs ws
alongside wrtc, accepts the offer over a WebSocket, answers it, relays ICE candidates, and holds
the resulting MediaStream; when GET /image is hit it starts a fresh fluent-ffmpeg pass over the
live track and pipes exactly one MJPEG frame back. Nothing is recorded. The Flask service is the
other half: it accepts a multipart POST /upload carrying the frame plus lat and lon form
fields and serves the most recent one at /latest_frame, so the dashboard can show what the camera
sees and where it was standing.
Keeping the stream and the still separate is what makes it work at all. WebRTC gives you a live
track and nothing you can put in an <img>; the console needs a still it can show next to a map pin.
Rendering the frame on demand rather than transcoding continuously means the relay costs nothing
while nobody is watching.
Honest scope
I worked on this as one of a team rather than owning it end to end, and it was built inside a hackathon window. The mapping, the area calculation and the video path are real and work against real coordinates. The monitoring-logs screen still runs against fixture lands rather than live sensor data, and the console talks to five services on five hardcoded localhost ports, so it only runs on the machine it was demoed from.
The API side has its own seams. POST /create-order is registered twice in app.js; Express matches
the first, so the second copy, the pre-ledger version that returned a certificate and stopped, is
unreachable dead code. The seller credit update filters on land_hash and increments credits_sold,
neither of which exists on the Land schema, so with an upsert it quietly writes a fresh near-empty
land document instead of crediting anybody. The purchase posts a transaction whose sender and
receiver are freshly generated UUIDs rather than the buyer and the landowner, so the ledger records a
transfer between two identities that exist for the duration of one request. The costing call sends a
fixed area rather than the one just computed from the polygon, the OpenWeatherMap key is a string
literal in the source, and market supply, demand and the adjustment factor are constants in the
request handler rather than inputs.
The measurement half is looser than it looks. The green-cover masks overlap by construction - the
light-green hue band from 35 to 85 fully contains the dark-green band from 40 to 70 - so every dark
pixel is counted twice in the total, and the upload handler writes every request to the same
./uploaded_image.jpg path, which two concurrent users would fight over. More fundamentally, a green
mask is a colour detector and not a tree detector: a painted roof passes.
The rest is what a hackathon leaves. The registration form binds three of its text fields to the same
piece of state. The Flask relay's OpenCV path, which burned the coordinates into the frame with
cv2.putText, is commented out, so the image and its position travel together as far as the server
and then separate. And poly.js still contains a function that assigns a police officer to the
locked polygon and downloads the result as duties.json, because the drawing code was lifted from
the SafetySync patrol dashboard - the Flutter client's package name is still rjpolice.
Project Details
Contributor
2024
SAP Hackfest 2024 — Winner (25,000 participants)
Hackathon · Web